This post is essentially an updated guide to my previous post on monitoring pfSense logs using the ELK stack. Part 1 will cover the instillation and configuration of ELK and Part 2 will cover configuring Kibana 4 to visualize pfSense logs.
So what's new?
- Full guide to installing & setting up ELK on Linux
- Short tutorial on creating visualizations and dashboards using collected pfSense logs
OK. So the goal is to use ELK to gather and visualize firewall logs from one (or more) pfSense servers.
This Logstash / Kibana setup has three main components:
- Logstash: Processes the incoming logs sent from pfSense
- Elasticsearch: Stores all of the logs
- Kibana 4: Web interface for searching and visualizing logs (proxied through Nginx)
(It is possible to manually install the logstash-forwarder on pfsense, however this tutorial will only cover forwarding logs via the default settings in pfSense.)

For this tutorial all three components (ElasticSearch, Logstash & Kibana + Nginx) will be installed on a single server.
Prerequisites:
1. For CentOS 7, enable the EPEL repository
# rpm -Uvh https://dl.fedoraproject.org/pub/epel/epel-release-latest-7.noarch.rpm
2. Make sure wget is installed
CentOS 7
# sudo yum -y install wget
Ubuntu 14.xx
$ sudo apt-get -y install wget
3. Install the latest JDK on your server:
CentOS 7
Download Java SDK:
# wget --no-check-certificate -c --header "Cookie: oraclelicense=accept-securebackup-cookie" http://download.oracle.com/otn-pub/java/jdk/8u60-b27/jdk-8u60-linux-x64.tar.gz
# tar -xzf jdk-8u60-linux-x64.tar.gz
# mv jdk1.8.0_60/ /usr/
Install Java:
# /usr/sbin/alternatives --install /usr/bin/java java /usr/jdk1.8.0_60/bin/java 2

# /usr/sbin/alternatives --config java
There is 1 program that provides 'java'.

  Selection    Command
-----------------------------------------------
*+ 1           /usr/jdk1.8.0_60/bin/java

Enter to keep the current selection[+], or type selection number:
Press ENTER
Verify Java Verison:
# java -version

java version "1.8.0_60"
Java(TM) SE Runtime Environment (build 1.8.0_60-b27)
Java HotSpot(TM) 64-Bit Server VM (build 25.60-b23, mixed mode)
Setup Environment Variables:
# export JAVA_HOME=/usr/jdk1.8.0_60/

# export JRE_HOME=/usr/jdk1.8.0_60/jre/
Set PATH variable:
# export PATH=$JAVA_HOME/bin:$PATH
To set it as a permanent, place the above three commands in the /etc/profile (All Users) or .bash_profile (Single User)
Ubuntu 14.xx
Remove the OpenJDK from the system, if you have it already installed.
$ sudo apt-get remove --purge openjdk*
Add repository.
$ sudo add-apt-repository -y ppa:webupd8team/java
Run the apt-get update command to pull the packages information from the newly added repository.
$ sudo apt-get update
Issue the following command to install Java jdk 1.8.
$ sudo apt-get -y install oracle-java8-installer
While installing, you will be required to accept the Oracle binary licenses.
Verify java version
$ java -version

java version "1.8.0_60"
Java(TM) SE Runtime Environment (build 1.8.0_60-b27)
Java HotSpot(TM) 64-Bit Server VM (build 25.60-b23, mixed mode)
Configure java Environment
$ sudo apt-get install oracle-java8-set-default
Install ElasticSearch
Download and install the public GPG signing key:
CentOS 7
# rpm --import https://packages.elastic.co/GPG-KEY-elasticsearch
Ubuntu 14.xx
$ wget -qO - https://packages.elasticsearch.co/GPG-KEY-elasticsearch | sudo apt-key add -
Add and enable ElasticSearch repo:
CentOS 7
# cat <<EOF >> /etc/yum.repos.d/elasticsearch.repo
[elasticsearch-1.7]
name=Elasticsearch repository for 1.7.x packages
baseurl=http://packages.elastic.co/elasticsearch/1.7/centos
gpgcheck=1
gpgkey=http://packages.elastic.co/GPG-KEY-elasticsearch
enabled=1
EOF
Ubuntu 14.xx
$ echo "deb http://packages.elastic.co/elasticsearch/1.7/debian stable main" | sudo tee -a /etc/apt/sources.list.d/elasticsearch-1.7.list
Install ElasticSearch
CentOS 7
# yum -y install elasticsearch
Ubuntu 14.xx
$ sudo apt-get update && sudo apt-get install elasticsearch
Configure Elasticsearch to auto-start during system startup:
CentOS 7
# /bin/systemctl daemon-reload
# /bin/systemctl enable elasticsearch.service
# /bin/systemctl start elasticsearch.service
Ubuntu 14.xx
$ sudo update-rc.d elasticsearch defaults 95 10
Now wait, at least a minute to let the Elasticsearch get fully restarted, otherwise testing will fail. ElasticSearch should be now listen on 9200 for processing HTTP request, we can use CURL to get the response.
# curl -X GET http://localhost:9200
{
  "status" : 200,
  "name" : "Alex",
  "cluster_name" : "elasticsearch",
  "version" : {
    "number" : "1.7.1",
    "build_hash" : "b88f43fc40b0bcd7f173a1f9ee2e97816de80b19",
    "build_timestamp" : "2015-07-29T09:54:16Z",
    "build_snapshot" : false,
    "lucene_version" : "4.10.4"
  },
  "tagline" : "You Know, for Search"
}
Install Logstash
Add the Logstash repo, enable & install
CentOS 7
# cat <<EOF >> /etc/yum.repos.d/logstash.repo
[logstash-1.5]
name=Logstash repository for 1.5.x packages
baseurl=http://packages.elasticsearch.org/logstash/1.5/centos
gpgcheck=1
gpgkey=http://packages.elasticsearch.org/GPG-KEY-elasticsearch
enabled=1
EOF
# yum install logstash -y
Ubuntu 14.xx
$ echo "deb http://packages.elasticsearch.org/logstash/1.5/debian stable main" | sudo tee -a /etc/apt/sources.list
$ sudo apt-get update && sudo apt-get install logstash
Create SSL Certificate (Optional)*
*You can skip this step if you don't intend to use your ELK install to monitor logs for anything other than pfSense (or any TCP/UDP forwarded logs).
(pfSense forwards it's logs via UDP, therefore there's no requirement to set up a Logstash-Forwarder environment. Having said that, it's still good practice to set it up, since you'll most likely be using your ELK stack for more than collecting and parsing only pfSense logs.)
Logstash-Forwarder (formerly LumberJack) utilizes an SSL certificate and key pair to verify the identity of your Logstash server.
You have two options when generating this SSL certificate.
1. Hostname/FQDN (DNS) Setup
2. IP Address Setup
Option 1
If you have DNS setup within your private/internal network, add a DNS A record pointing to the private IP address of your ELK/Logstash server. Alternatively add a DNS A record with your DNS provider pointing to your ELK/Logstash servers public IP address. As long as each server you're gathering logs from can resolve the Logstash servers hostname/domain name, either is fine.
Alternatively you can edit the etc/hosts file of the servers you're collecting logs from by adding an IP address (Public or Private) and hostname entry pointing to your Logstash server (Private IP 192.168.0.77 in my case).
# nano /etc/hosts

192.168.0.77 elk.mydomain.com elk
Now to generate the SSL certificate and key pair. Go to OpenSSL directory.
CentOS 7
# cd /etc/pki/tls
Ubuntu 14.xx
Use the following commands to create the directories that will store you certificate and private key.
$ sudo mkdir -p /etc/pki/tls/certs
$ sudo mkdir /etc/pki/tls/private
Execute the following command to create a SSL certificate, replace “elk” with the hostname of your real logstash server.
# cd /etc/pki/tls
# openssl req -x509 -nodes -newkey rsa:2048 -days 3650 -keyout private/logstash-forwarder.key -out certs/logstash-forwarder.crt -subj /CN=elk
The generated logstash-forwarder.crt should be copied to all client servers who's logs you intend to send to your Logstash server.
N.B. If you've decided to go with the above described Option 1, please ignore Option 2 below, and skip straight to the 'Configure Logstash' section.
Option 2
If for some reason you don't have DNS setup and/or can't resolve the hostname of your Logstash server, you can add the IP address of your Logstash server to the subjectAltName (SAN) of the certificate we're about to generate.
Start by editing the OpenSSL configuration file:
$ nano /etc/pki/tls/openssl.cnf
Find the section starting with [ v3_ca ] and add the following line, substituting the IP address for that of your own Logstash server.
subjectAltName = IP: 192.168.0.77
Save & exit
Execute the following command to create the SSL certificate and private key.
# cd /etc/pki/tls
# openssl req -config /etc/pki/tls/openssl.cnf -x509 -days 3650 -batch -nodes -newkey rsa:2048 -keyout private/logstash-forwarder.key -out certs/logstash-forwarder.crt
The generated logstash-forwarder.crt should be copied to all client servers you intend to collect logs from.
Configure Logstash
Logstash configuration files are JSON-Format files located in the /etc/logstash/conf.d/ directory. A Logstash server configuration consists of three sections; input, filter and output, all of which can be placed in a single configuration file. However in practice is it's much more practical to place these sections into separate config files.
Create an input configuration:
# nano /etc/logstash/conf.d/01-inputs.conf
Paste the following:
#logstash-forwarder [Not utilized by pfSense by default]
#input {
#  lumberjack {
#    port => 5000
#    type => "logs"
#    ssl_certificate => "/etc/pki/tls/certs/logstash-forwarder.crt"
#    ssl_key => "/etc/pki/tls/private/logstash-forwarder.key"
#  }
#}

#tcp syslog stream via 5140
input {
  tcp {
    type => "syslog"
    port => 5140
  }
}
#udp syslogs tream via 5140
input {
  udp {
    type => "syslog"
    port => 5140
  }
}
Create an syslog configuration:
# nano /etc/logstash/conf.d/10-syslog.conf
Paste the following:
filter {
  if [type] == "syslog" {

    #change to pfSense ip address
    if [host] =~ /192\.168\.0\.2/ {
      mutate {
        add_tag => ["PFSense", "Ready"]
      }
    }

    if "Ready" not in [tags] {
      mutate {
        add_tag => [ "syslog" ]
      }
    }
  }
}

filter {
  if [type] == "syslog" {
    mutate {
      remove_tag => "Ready"
    }
  }
}

filter {
  if "syslog" in [tags] {
    grok {
      match => { "message" => "%{SYSLOGTIMESTAMP:syslog_timestamp} %{SYSLOGHOST:syslog_hostname} %{DATA:syslog_program}(?:\[%{POSINT:syslog_pid}\])?: %{GREEDYDATA:syslog_message}" }
      add_field => [ "received_at", "%{@timestamp}" ]
      add_field => [ "received_from", "%{host}" ]
    }
    syslog_pri { }
    date {
      match => [ "syslog_timestamp", "MMM  d HH:mm:ss", "MMM  dd HH:mm:ss" ]
      locale => "en"
    }

    if !("_grokparsefailure" in [tags]) {
      mutate {
        replace => [ "@source_host", "%{syslog_hostname}" ]
        replace => [ "@message", "%{syslog_message}" ]
      }
    }

    mutate {
      remove_field => [ "syslog_hostname", "syslog_message", "syslog_timestamp" ]
    }
#    if "_grokparsefailure" in [tags] {
#      drop { }
#    }
  }
}
Create an outputs configuration:
# nano /etc/logstash/conf.d/30-outputs.conf
Paste the following:
output {
elasticsearch { hosts => localhost index => "logstash-%{+YYYY.MM.dd}" }
stdout { codec => rubydebug }
}
Create your pfSense configuration:
# nano /etc/logstash/conf.d/11-pfsense.conf
Paste the following:
filter {
  if "PFSense" in [tags] {
    grok {
      add_tag => [ "firewall" ]
      match => [ "message", "<(?<evtid>.*)>(?<datetime>(?:Jan(?:uary)?|Feb(?:ruary)?|Mar(?:ch)?|Apr(?:il)?|May|Jun(?:e)?|Jul(?:y)?|Aug(?:ust)?|Sep(?:tember)?|Oct(?:ober)?|Nov(?:ember)?|Dec(?:ember)?)\s+(?:(?:0[1-9])|(?:[12][0-9])|(?:3[01])|[1-9]) (?:2[0123]|[01]?[0-9]):(?:[0-5][0-9]):(?:[0-5][0-9])) (?<prog>.*?): (?<msg>.*)" ]
    }
    mutate {
      gsub => ["datetime","  "," "]
    }
    date {
      match => [ "datetime", "MMM dd HH:mm:ss" ]
      timezone => "UTC"
    }
    mutate {
      replace => [ "message", "%{msg}" ]
    }
    mutate {
      remove_field => [ "msg", "datetime" ]
    }
}
if [prog] =~ /^filterlog$/ {
    mutate {
      remove_field => [ "msg", "datetime" ]
    }
    grok {
      patterns_dir => "/etc/logstash/conf.d/patterns"
      match => [ "message", "%{PFSENSE_LOG_DATA}%{PFSENSE_IP_SPECIFIC_DATA}%{PFSENSE_IP_DATA}%{PFSENSE_PROTOCOL_DATA}",
		 "message", "%{PFSENSE_LOG_DATA}%{PFSENSE_IPv4_SPECIFIC_DATA_ECN}%{PFSENSE_IP_DATA}%{PFSENSE_PROTOCOL_DATA}" ]
    }
    mutate {
      lowercase => [ 'proto' ]
    }
    geoip {
      add_tag => [ "GeoIP" ]
      source => "src_ip"
      # Optional GeoIP database
      database => "/etc/logstash/GeoLiteCity.dat"
    }
  }
}
The above configuration uses a pattern file. Create a patterns directory:
# mkdir /etc/logstash/conf.d/patterns
And download the following pattern file to it:
# cd /etc/logstash/conf.d/patterns
# wget https://gist.githubusercontent.com/elijahpaul/3d80030ac3e8138848b5/raw/abba6aa8398ba601389457284f7c34bbdbbef4c7/pfsense2-2.grok
(Optional) Download and install the MaxMind GeoIP database:
$ cd /etc/logstash
$ sudo curl -O "http://geolite.maxmind.com/download/geoip/database/GeoLiteCity.dat.gz"
$ sudo gunzip GeoLiteCity.dat.gz
Now restart the logstash service.
CentOS 7
# systemctl restart logstash.service
Ubuntu 14.xx
$ sudo service logstash restart
Logstash server logs are stored in the following file,
# cat /var/log/logstash/logstash.log
Logs retrieved from pfSense (once setup is complete) can be viewed via,
# tail -f /var/log/logstash/logstash.stdout
these will help you troubleshoot any issues you encounter.
Configuring pfSense for remote logging to ELK
Login to pfSense and check the dashboard to ensure you're running pfSense 2.2.x

Now go to the settings tab via Status > System Logs. Check 'Send log messages to remote syslog server', enter your ELK servers IP address and custom port (port 5140 in this case), and check 'Firewall events' (or 'Everything' if you wish to send everything pfSense logs to ELK).
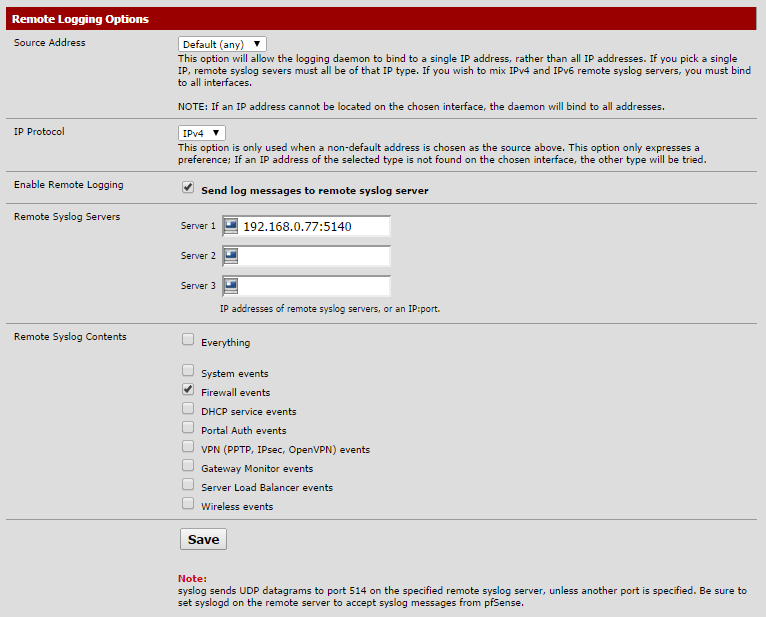
That's it for pfSense!
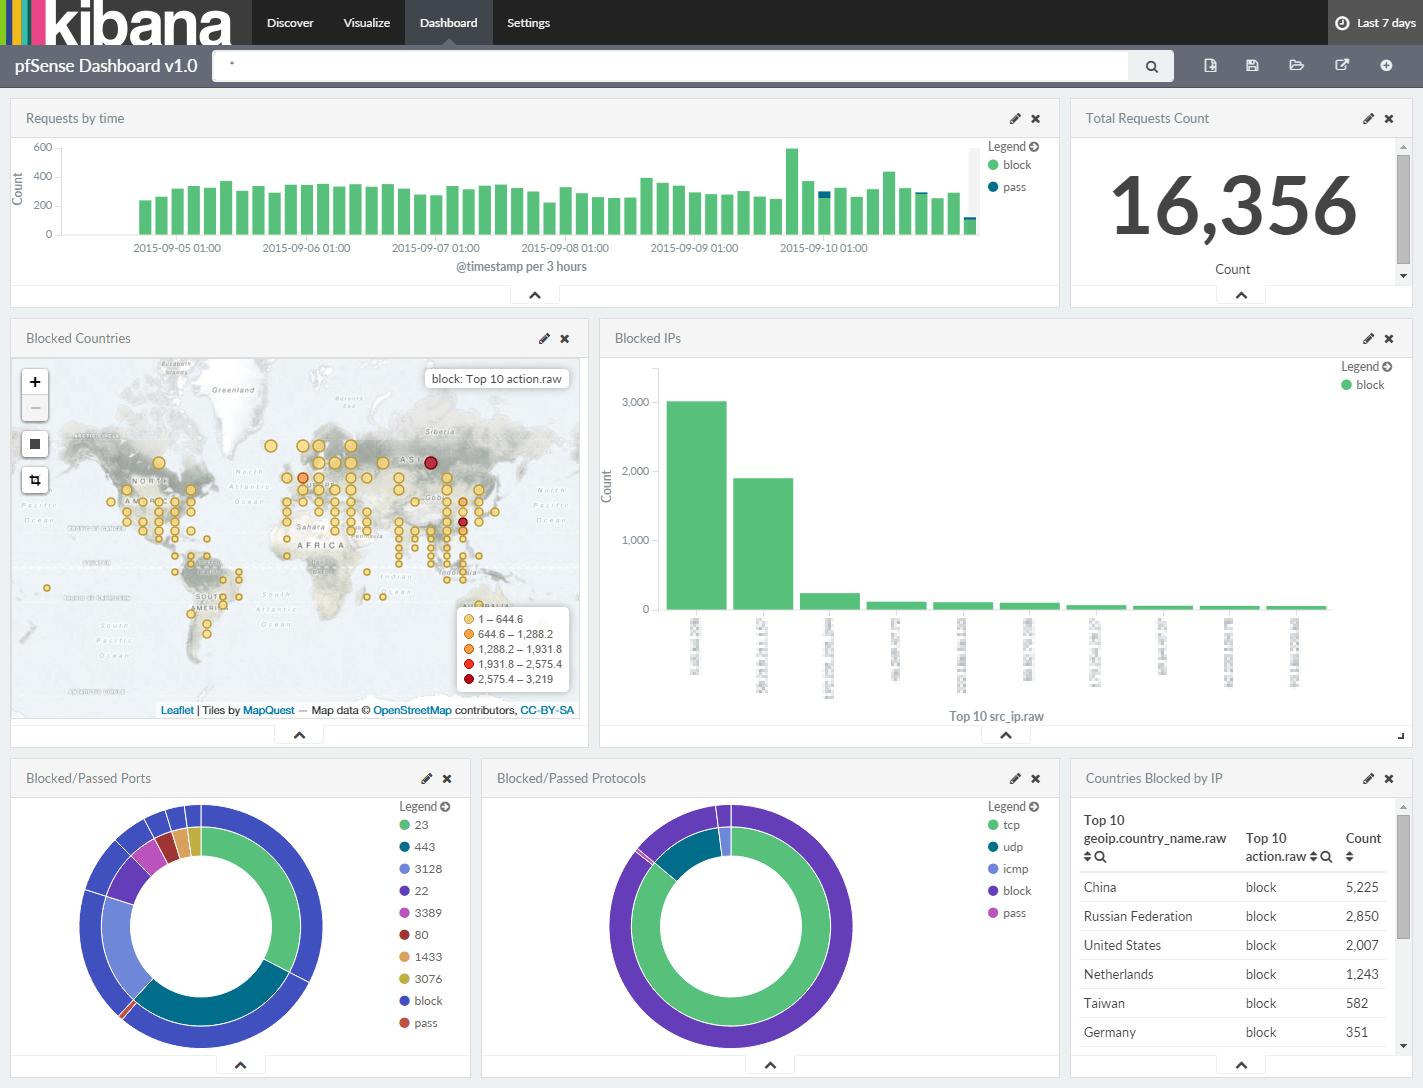
Configure Kibana4
Kibana 4 provides visualization of your pfSense logs. Use the following command to download it in terminal.
wget https://download.elastic.co/kibana/kibana/kibana-4.1.2-linux-x64.tar.gz
# tar -zxf kibana-4.1.2-linux-x64.tar.gz

# mv kibana-4.1.2-linux-x64 /opt/kibana4
Enable PID file for Kibana, this is required to create a systemd init file.
# sed -i 's/#pid_file/pid_file/g' /opt/kibana4/config/kibana.yml
Kibana can be started by running /opt/kibana4/bin/kibana, to run kibana as a server we will create a systemd file.
# nano /etc/systemd/system/kibana4.service

[Unit]
Description=Kibana 4 Web Interface
After=elasticsearch.service
After=logstash.service
[Service]
ExecStartPre=rm -rf /var/run/kibana.pid
ExecStart=/opt/kibana4/bin/kibana
ExecReload=kill -9 $(cat /var/run/kibana.pid) && rm -rf /var/run/kibana.pid && /opt/kibana4/bin/kibana
ExecStop=kill -9 $(cat /var/run/kibana.pid)
[Install]
WantedBy=multi-user.target
Start and enable kibana to start automatically at system startup.
# systemctl start kibana4.service

# systemctl enable kibana4.service
Check to see if Kibana is working properly by going to http://your-ELK-IP:5601/ in your browser.
You should see the following page where you have to map Logstash index to use Kibana. From the Time-field name dropdown menu select @timestamp.

Spot any mistakes/errors? Or have any suggestions? Please make a comment below.