
Scroll to the bottom for the update on applying this tutorial to the new pfSense 2.2 log format
What is pfSense?
Only the best open source, software based firewall there is (I'm biased). I use it a lot, especially in virtualized environments. https://www.pfsense.org/
What is ELK?
ELK (ElasticSearch, Logstash, Kibana) is a pretty cool open source stack that enables you to collect, store, search and visualize logs from almost any system that outputs logs, all to a centralised location/server.
Check out the elasticsearch website for more detailed info.
Installing ELK on Linux
There are quite a few tutorials out there on installing ELK on various Linux distributions. Here's a list of the few I found very helpful:
http://www.ragingcomputer.com/2014/02/monitoring-pfsense-with-logstash-elasticsearch-kibana
https://blog.devita.co/2014/09/04/monitoring-pfsense-firewall-logs-with-elk-logstash-kibana-elasticsearch/ <= I used this one.
IP Setup in this tutorial
pfSense Server IP (WAN): 172.16.0.1
pfSense Server IP (LAN): 192.168.0.2
ELK server IP: 192.168.0.77
Substitute the above IPs for the appropriate ones in your own setup.
Configuring pfSense for remote logging to ELK
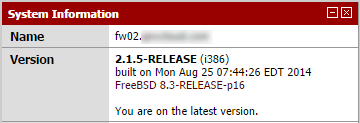
Login to pfSense and check the dashboard to ensure you're running pfSense 2.1
Now go to the settings tab via Status > System Logs. Check 'Send log messages to remote syslog server', enter your ELK servers IP address (and port if you've set it to something other than the default port 514 in the Logstash config), and check 'Firewall events' (or 'Everything' if you wish to send everything pfSense logs to ELK).

Configuring Logstash to parse pfSense logs
Now back on your ELK server, add the following filter to your logstash.conf file in the /etc/logstash/conf.d/ configuration directory, or in a separate pfSense config file (depending on your setup) e.g. 11-pfsense.conf.
filter {
      #change to pfSense ip address
      if [host] =~ /172\.16\.0\.1/ {
          grok {
                  add_tag => [ "firewall" ]
                  match => [ "message", "<(?<evtid>.*)>(?<datetime>(?:Jan(?:uary)?|Feb(?:ruary)?|Mar(?:ch)?|Apr(?:il)?|May|Jun(?:e)?|Jul(?:y)?|Aug(?:ust)?|Sep(?:tember)?|Oct(?:ober)?|Nov(?:ember)?|Dec(?:ember)?)\s+(?:(?:0[1-9])|(?:[12][0-9])|(?:3[01])|[1-9]) (?:2[0123]|[01]?[0-9]):(?:[0-5][0-9]):(?:[0-5][0-9])) (?<prog>.*?): (?<msg>.*)" ]
              }
              mutate {
                  gsub => ["datetime","  "," "]
              }
              date {
                  match => [ "datetime", "MMM dd HH:mm:ss" ]
              timezone => "Europe/London"
              }
              mutate {
                  replace => [ "message", "%{msg}" ]
              }
              mutate {
                  remove_field => [ "msg", "datetime" ]
              }
          }
          if [prog] =~ /^pf$/ {
              mutate {
                  add_tag => [ "packetfilter" ]
              }
              multiline {
                  pattern => "^\s+|^\t\s+"
                  what => "previous"
              }
              mutate {
                  remove_field => [ "msg", "datetime" ]
                  remove_tag => [ "multiline" ]
              }
              grok {
                  match => [ "message", "rule (?<rule>.*)\(.*\): (?<action>pass|block) (?<direction>in|out).* on (?<iface>.*): .* proto (?<proto>TCP|UDP|IGMP|ICMP) .*\n\s*(?<src_ip>(\d+\.\d+\.\d+\.\d+))\.?(?<src_port>(\d*)) [<|>] (?<dest_ip>(\d+\.\d+\.\d+\.\d+))\.?(?<dest_port>(\d*)):" ]
              }
              if [prog] =~ /^dhcpd$/ {
              if [message] =~ /^DHCPACK|^DHCPREQUEST|^DHCPOFFER/ {
                  grok {
                      match => [ "message", "(?<action>.*) (on|for|to) (?<src_ip>[0-2]?[0-9]?[0-9]\.[0-2]?[0-9]?[0-9]\.[0-2]?[0-9]?[0-9]\.[0-2]?[0-9]?[0-9]) .*(?<mac_address>[0-9a-fA-F][0-9a-fA-F]:[0-9a-fA-F][0-9a-fA-F]:[0-9a-fA-F][0-9a-fA-F]:[0-9a-fA-F][0-9a-fA-F]:[0-9a-fA-F][0-9a-fA-F]:[0-9a-fA-F][0-9a-fA-F]).* via (?<iface>.*)" ]
                  }
              }
              if [message] =~ /^DHCPDISCOVER/ {
                  grok {
                      match => [ "message", "(?<action>.*) from (?<mac_address>[0-9a-fA-F][0-9a-fA-F]:[0-9a-fA-F][0-9a-fA-F]:[0-9a-fA-F][0-9a-fA-F]:[0-9a-fA-F][0-9a-fA-F]:[0-9a-fA-F][0-9a-fA-F]:[0-9a-fA-F][0-9a-fA-F]).* via (?<iface>.*)" ]
                  }
              }
              if [message] =~ /^DHCPINFORM/ {
                  grok {
                      match => [ "message", "(?<action>.*) from (?<src_ip>.*).* via (?<iface>.*)" ]
                  }
              }
             }
          geoip {
            add_tag => [ "GeoIP" ]
            source => "src_ip"
          }
      }
}
Note : The above config should be placed either in your logstash.conf file, or in it's own separate pfSense config file, e.g. 11-pfsense.conf. Don't forget to substitute in your own pfSense IP.
I followed Mike DeVita's guide and so have my pfsense config file separate. Also, my pfSense host IP is tagged "PFSense" in my 10-syslog.conf file:
if [host] =~ /172\.16\.0\.1/ {
      mutate {
        add_tag => ["PFSense", "Ready"]
      }
    }
Again. See Mike DeVita's guide for more details on this setup. The dashboard I built in Kibana is also based on this setup.
The GeoIP Filter
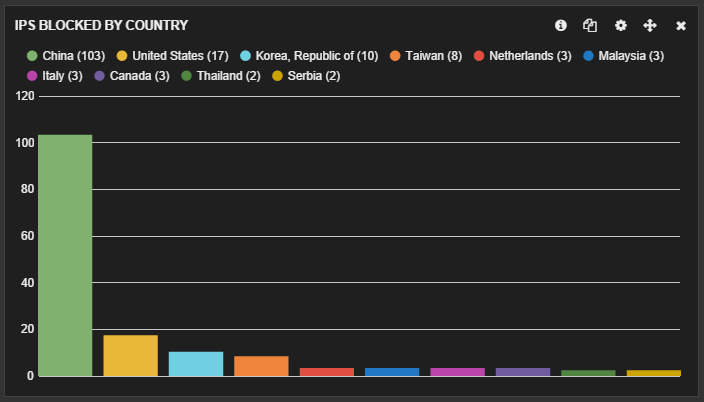
Including the GeoIP filter means you can filter pfSense's logged IPs by country. The default Logstash installation includes a GeoIP database based on data from the Maxmind database (the database => option allows you to include a path to an alternate GeoIP DB that Logstash should use instead, e.g. a downloaded DB). This means you can build cool panels in Kibana (like the one below) visualising which countries your pfSense firewall is filtering by count or percentage.
The built-in GeoIP filter includes a bunch of GeoIP fields all of which are included by default. You may not require the full set, in which case you can select only those you intend to use via the fields array option. (http://logstash.net/docs/1.4.2/filters/geoip#fields)
I've left mine set to include all fields in case I wish to filter the logs by these additional fields at a later date.
505Forensics has a great (detailed) post on configuring GeoIP location in Logstash: http://www.505forensics.com/who-have-your-logs-been-talking-to/
Restart Logstash
For the config file(s) to take effect:
# service logastash restart
Check Logstash pfSense config is working
Running the following command on the ELK server terminal allows you to view the formatted incoming logs from pfSense live:
# tail -f /var/log/logstash/logstash.stdout
You should see neatly formatted logs similar to the one below pop up every few seconds (depending on your firewalls volume of traffic):
{
       "message" => "00:00:04.940687 rule 3/0(match): block in on em0: (tos 0x0, ttl 252, id 1, offset 0, flags [DF], proto ICMP (1), length 32)\n    92.972.185.1 > 172.16.0.1: ICMP echo request, id 31127, seq 1, length 12",
      "@version" => "1",
    "@timestamp" => "2014-10-12T09:05:19.000Z",
          "type" => "syslog",
          "host" => "172.16.0.1",
          "tags" => [
        [0] "PFSense",
        [1] "firewall",
        [2] "packetfilter",
        [3] "GeoIP"
    ],
         "evtid" => "134",
          "prog" => "pf",
          "rule" => "3/0",
        "action" => "block",
     "direction" => "in",
         "iface" => "em0",
         "proto" => "ICMP",
        "src_ip" => "92.972.185.1",
       "dest_ip" => "172.16.0.1",
         "geoip" => {
                    "ip" => "92.972.185.1",
         "country_code2" => "DE",
         "country_code3" => "DEU",
          "country_name" => "Germany",
        "continent_code" => "EU",
              "latitude" => 51.0,
             "longitude" => 9.0,
              "timezone" => "Europe/Berlin",
              "location" => [
            [0] 9.0,
            [1] 51.0
        ]
    }
}
The Kibana Dashboard
My dashboard is a version of Mike DeVita's pfSense dashboard altered to include GeoIP visualisations of pfSense's logs. I also added a couple of extra panels to visualize which destination port numbers are being blocked the most...

And a map visualizing which countries are most blocked by IP.
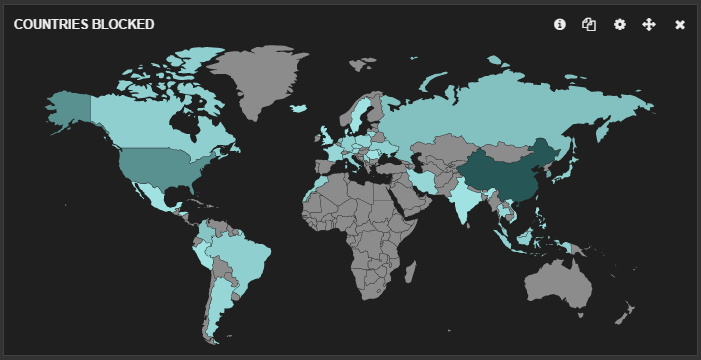
Link to Dashboard Gist: a1b0296ff442a95e9046
Issues
Initially I did have an issue where the logs pfSense sent to ELK were timestamped with the wrong timezone. This was occurring despite the same timezone (BST) being configured on both servers. I managed to resolve this by adding the timezone option to the date section in my 11-pfsense.conf config file in /etc/logstash/conf.d/.
Update: New filter for pfSense 2.2 (N.B. This filter currently doesn't parse ICMPv6 logs)
Quite a few people requested an updated filter to manage the new log format in pfSense 2.2. The new log format is comma-separated CSV, which is much easier to parse, however packet filter logs do vary in length depending on the IP version and protocol being logged.
The filter below, together with THIS custom pattern file (courtesy of J. Pisano; mega thanks) parses logs for both IPv4 & IPv6 and TCP, UDP and ICMP protocols (currently excluding ICMPv6).
Place the pfsense2-2.grok file in your patterns folder and make sure to refer to your patterns directory location in the filter via the patterns_dir setting.
Any suggestions for corrections and/or improvement are welcome. :)
filter {
  if "PFSense" in [tags] {
    grok {
      add_tag => [ "firewall" ]
      match => [ "message", "<(?<evtid>.*)>(?<datetime>(?:Jan(?:uary)?|Feb(?:ruary)?|Mar(?:ch)?|Apr(?:il)?|May|Jun(?:e)?|Jul(?:y)?|Aug(?:ust)?|Sep(?:tember)?|Oct(?:ober)?|Nov(?:ember)?|Dec(?:ember)?)\s+(?:(?:0[1-9])|(?:[12][0-9])|(?:3[01])|[1-9]) (?:2[0123]|[01]?[0-9]):(?:[0-5][0-9]):(?:[0-5][0-9])) (?<prog>.*?): (?<msg>.*)" ]
    }
    mutate {
      gsub => ["datetime","  "," "]
    }
    date {
      match => [ "datetime", "MMM dd HH:mm:ss" ]
    }
    mutate {
      replace => [ "message", "%{msg}" ]
    }
    mutate {
      remove_field => [ "msg", "datetime" ]
    }
}
if [prog] =~ /^filterlog$/ {
    mutate {
      remove_field => [ "msg", "datetime" ]
    }
    grok {
      patterns_dir => "./patterns"
      match => [ "message", "%{LOG_DATA}%{IP_SPECIFIC_DATA}%{IP_DATA}%{PROTOCOL_DATA}" ]
    }
    mutate {
      lowercase => [ 'proto' ]
    }
    geoip {
      add_tag => [ "GeoIP" ]
      source => "src_ip"
    }
  }
}
Credits
Main credit goes to Mike DeVita's guide for pfSense 2.2, off which I based my config and dashboard.
Resources